
Trading strategy: Hammer Pattern
Description
The Hammer is a type of candle. Individual candles are of limited value to traders. Candle patterns -recurring combinations of candles- are much more interesting. Stefan Salomon, who maintains www.candlestick.de, identified a candlestick pattern around the Hammer candle. This pattern forms the basis of one of his trading strategies. The code for the strategy was developed by Claus Grube, himself the author of several trading strategies.
| Suitable for | : Market indices (FTSE, DAX, AEX …) : Shares |
| Instruments | : Futures and CFDs |
| Trading type | : Swing trading |
| Trading tempo | : 1-3 Signals per day using Scripts or LiveTables |
| The strategy | : Video |
| Using NanoTrader Full | : Manual or semi-automated |
The strategy in detail
The Hammer candle is defined as a candle which occurs at the end of a down-trend, which has a small body, almost no shadow above, and a longer shadow below.
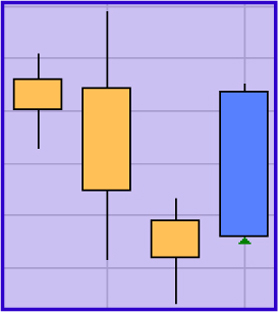
The Hammer pattern is a pattern consisting of four candles. The two first candles need to be bearish candles. The third candle needs to be a Hammer candle. The fourth candle must be a bullish candle. The open of the fourth candle must be above the close of the Hammer candle.
An example of a Hammer pattern.
A Hammer pattern indicates a probable trend reversal. Hence, the strategy can be classified as a reversal strategy. A reversal strategy aims to identify the point in time when a trend reverses direction. The strategy is usually applied in a day or 60-minute timeframe.
When to open a position?
As soon as the Hammer pattern is confirmed by the fourth
candle (the bullish candle with the higher open and close than
the Hammer candle), a long position is bought at the market
price at the next open. The strategy does not give short sell
signals.
When to close a position?
A position is closed by one of two stops. There is no target. One stop is the low of the Hammer candle. The other stop is a trailing stop. It is calculated as 3 times the 5-period ATR (Average True Range).
The NanoTrader Full platform allows traders to put in more than one stop at the same time. The platform will always activate the stop which is ‘safest’ i.e. the stop which is closed to the market price. In the Hammer pattern strategy the trailing stop is initially below the other stop. Once the position moves in the right direction, however, the trailing stop will move above the other stop. At this moment the trailing stop is retained as the live stop.
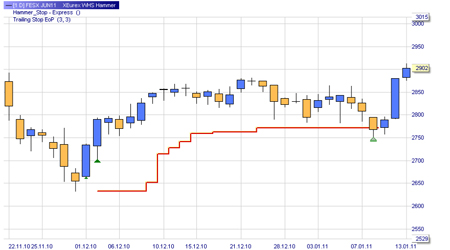
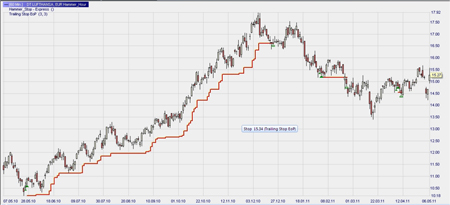
This example shows a long position after a Hammer pattern. Initially the stop is the low of the Hammer candle. Later, when the position evolves positively, the trailing stop takes over. The position is closed with a profit.
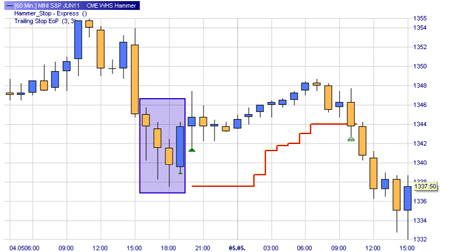
This example shows a Hammer pattern on a 60-minutes Mini S&P chart. Initially the stop is the low of the Hammer candle. Later, when the position evolves positively, the trailing stop takes over. The position is closed with a profit.
Attention: Hammer patterns are rare. Given the
rarity of the pattern, traders are obliged to check many
financial instruments every day to find a few which display
the pattern. WHS FutureStation Nano is superbly suitable for
this task. It offers both Scripts for scanning on a day basis
and Live Tables for real-time scanning. The Practical
Implementation section below explains how Live Tables and
Scripts can be used by everybody.
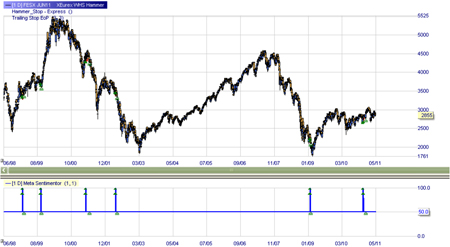
This example illustrates the rarity of the Hammer pattern. The pattern only occurred 6 times over a period of 10 years on the FDAX index.
Conclusion
The Hammer candlestick pattern strategy is used for trading
shares. The strategy is usually used in a day or 60-minute
timeframe. Traders could experiment with shorter timeframes.
Given the rarity of Hammer patterns traders usually do an
overnight (Script) or real-time (LiveTables) scan on a large
number of shares. The success rate of Hammer pattern signals
is probably about 50%. Losing signals, however, are usually
closed fairly quickly whereas positions based on winning
signals tend to remain open a long time.
This example shows one winning position and one losing position on Nvidia (60-minutes chart). The winning position remains open for a long time and generates a significant profit. The losing position is closed quickly with limited loss.
Practical implementation
In NanoTrader Full follow these steps:
- Choose the instrument you wish to trade.
- Open a chart with the template study "WHS Hammer".
- Semi-automated trading? Simply activate the TradeGuard+AutoOrder or the AutoOrder function.
Automating the search for signals: Scripts and LiveTables
Using a Script to search for signals
The purpose of a script is to scan many financial instruments in order to find signals. Some strategies, e.g. the Hammer pattern strategy, give few buy/sell signals. The quality of these signals, however, is high. The best way to trade such a strategy is via a Script.
A Script is usually used for trading markets on a day timeframe. It is executed in the morning or the evening of the day before so the trader can place his orders before the opening of the market.
1. Prepare the strategy.
Open the strategy with any financial instrument. In the
Designer window, at the bottom, set all parameters to
"Constant"...

2. Save the strategy as a default template.
Give it a name which indicates the strategy and timeframe. For
example, Hammer Day.
3. Create a new Script.
Open the WorkSpace Bar. Right-click Screeners. Select "New".

The Script Editor opens.

Give your Script a name. It is advisable to use the name of the strategy, the timeframe and the financial instruments you are going to use the Script for. E.g. Hammer Day Shares.
Click "Select Securities" and click the instruments you are interested in. Close the selection window. The instruments you selected are now visible in the Script Editor.
Note: the "Stop after" parameters are not relevant since we put the parameters in the strategy on constant.
Note: in the "Study settings" select the template study (strategy) you wish to apply. Put as Study-Label the same name you gave to your Script.
Click "Save & Run". The Script will start processing. You can see the progress.

When the Script has finished the result is visible in the RatingBar.

The result contains four categories:
- At the top are the financial instruments on which there is a
signal today. These we can trade now.
- Green lines: there was a signal in the past and a
theoretical position is still open. The last column
indicates if the theoretical position is currently profitable
or not. Also investigate this category.
A signal which is evolving positively may offer a trading
opportunity. In fact, some traders prefer
this to a "fresh" signal.
- Grey lines: there was a signal in the past but the
theoretical position is closed.
- The final category is instruments on which there has never
been a signal.
Note: To quickly see the graphs of each financial instrument in your result drag and drop the name from the RatingBar into an open chart.
Note: Once you ran your Script once you can simply run it every evening (after the close) or in the morning (before the open). Right-clicking your Script in the Scripts folder. Select "Create Status Report". This will give you the potential trades of the day.

Additional information on Scripts can be found in the Help file of the trading platform under "NanoTrader_TradingSystems".
Using LiveTables to search for signals
LiveTables perform real-time scans of strategies to a list of financial instruments. It is used for intraday strategies with a timeframe of minutes to one hour.
The first step, like with a Script, is to make the template study (or use a WHS template study like the Hammer). Set all variable parameters to "Constant" and save it as detailed above in Scripts.
Right-click LiveTables in the WorkSpace Bar. Select "New - Study". This opens a LiveTable.
From the WorkSpace Bar drag and drop the instrument you wish to scan into the LiveTable.
Right-click in the Study column of your LiveTable and select "Template Studies". Select the template study you wish to live scan on the instrument Save your LiveTable.